Capacity utilisation on recovery path after Covid dip: CARE Ratings
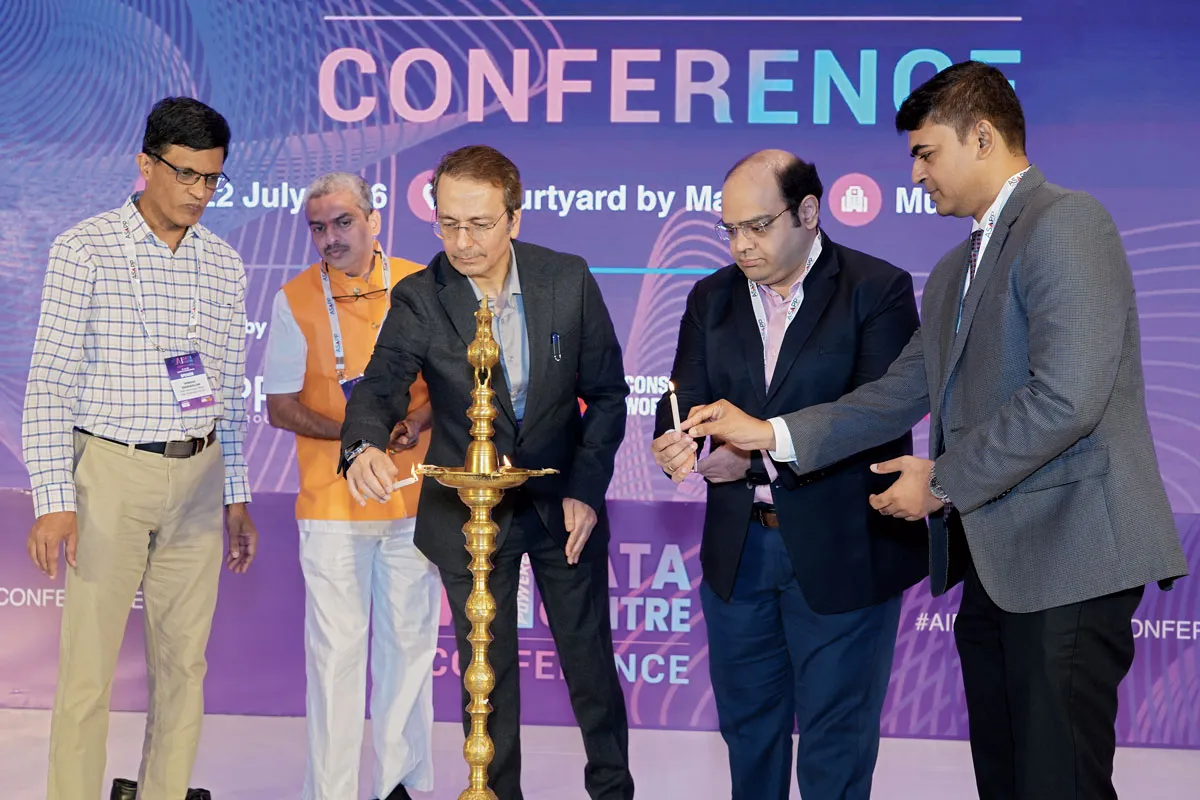
AI Data Centre Leaders Map India’s Infrastructure Roadmap
Mumbai, 22 July 2026: As artificial intelligence reshapes global digital infrastructure, industry leaders gathered in Mumbai today at the AI-Powered Data Centre Conference 2026 to discuss how India can build the capacity, technology and ecosystem required to emerge as a global AI infrastructure hub. Organised by ASAPP Info Global Group and conceptualised by FIRST Construction Council, the conference revolved around the theme, “From Capacity Gap to AI Superpower: Building India's Digital Backbone for the Intelligence Economy.” Bringing together developers, technology providers, enterpr..

SCLR Extension Nears Completion Linking BKC With Signal-Free Route
The Santacruz-Chembur Link Road (SCLR) extension towards Bandra-Kurla Complex (BKC) via the Mumbai University campus has entered its final stage, bringing motorists closer to a direct, signal-free connection between the Western Express Highway and the city’s commercial district. The elevated connector is being built as an arm from the SCLR alignment and will link the western suburbs with BKC without surface signals. The link is designed to reduce journey times for commuters travelling from the western suburbs to BKC and to improve access to eastern Mumbai. By carrying through traffic above s..

Raiganj MP Seeks Bengal Only Highway Link To Siliguri
Raiganj Member of Parliament Kartik Chandra Paul met Union Minister for Road Transport and Highways Nitin Gadkari in New Delhi to press for a new stretch of national highway in North Dinajpur district. He urged approval for a Bengal-to-Bengal link that would connect National Highways 12 and 27 to allow vehicles bound for Siliguri to avoid the current route through Kishanganj in neighbouring Bihar. He also submitted a proposed alignment of the new road to the ministry for consideration. At present vehicles from Raiganj travel along NH-12 and join NH-27 at Purnia More in Dalkhola, a route that p..
Latest Updates