Footprint in concrete
Concrete

Footprint in concrete

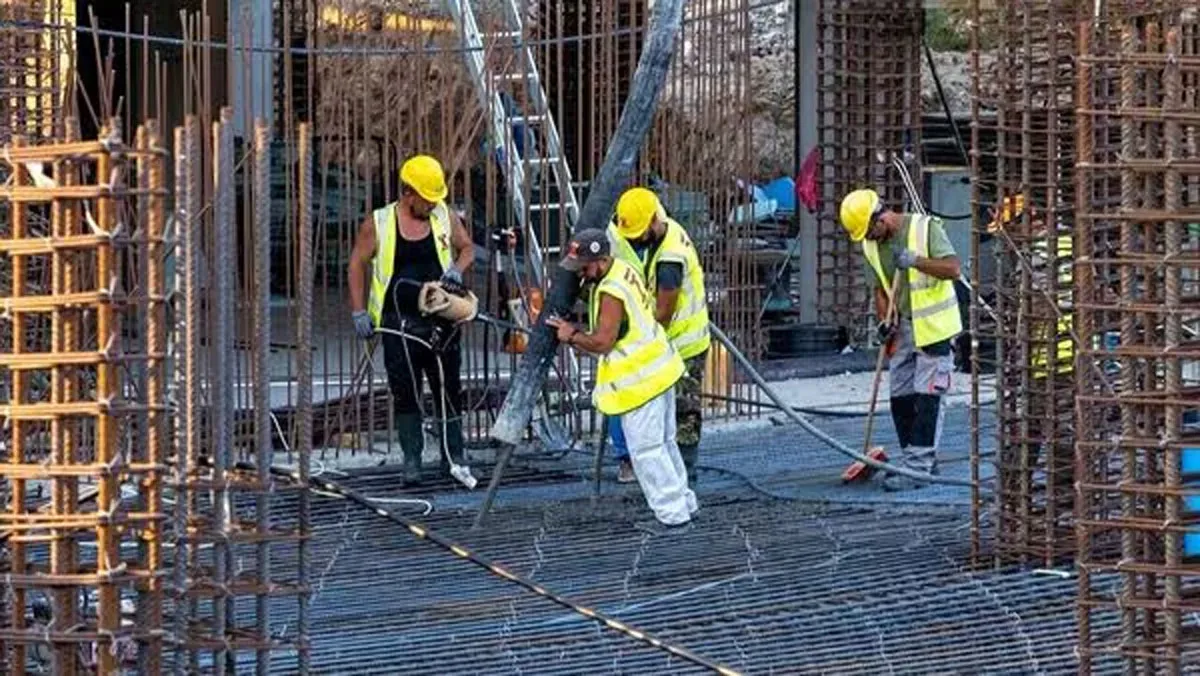
The construction industry's contribution to total anthropogenic greenhouse gas emissions is estimated at about 8 per cent, with cement being one of the highest emitters. SUNNY GOKLANI analyses the values of its carbon footprint.

Here's one footprint that will be hard to erase. The atmospheric concentration of carbon dioxide (CO2), which makes up about 77 per cent of anthropogenic greenhouse gas (GHG), was recorded at an unprecedented 392 ppm (parts per million) by volume in 2011, the highest in the past 20 million years. The green lining: India, the fifth largest emitter, has announced that it will aim to reduce the emissions intensity of its GDP by 20-25 per cent from 2005 levels by 2020. However, with a building material like cement being the largest contributor to emissions from construction, it is imperative to understand its carbon footprint.

Past research Actual calculations for the carbon footprint of concrete have only been published in the US and Europe. According to a study conducted at the Danish Technological Institute in 2008, cement accounted for almost 90 per cent of emissions while the remaining 10 per cent came from transportation and other constituents. In terms of footprint values, the range was observed from 0.12 kg CO2/kg of concrete with lower grades up to around 0.20 CO2/kg for higher grades of concrete. Suggested average in terms of CO2 density from the study was given as: 402 kg CO2/cu m of concrete.

The study

Findings from studies to compute the carbon footprint of concrete carried geographical limitations owing to the heterogeneous nature of concrete. Thus, this study aimed to identify and enumerate factors contributing to emissions in the production of concrete and compute the carbon footprint of concrete per cu m, and to study relationships amongst contributing factors. The scope of the study was confined to CO2 emissions from activities in production of concrete ranging from production of raw materials up to the mixing site, except reinforcement grades of concrete studied were M20 and M30. Case studies were geographically limited to Gujarat and suggestions limited to the Indian context.

Footprint computing methodology

The carbon footprint of concrete was taken as the sum total of footprints owing to individual contributions from its constituents and generic processes.

Carbon emissions for each individual constituent was taken again as a sum of emissions from various material-specific processes that went into the lifecycle of the constituent until it was ready to be mixed.

Emissions from each material-specific process were calculated through converting inputs from processing terms to emission equivalents, by employing conversion factors obtained through secondary data collection.

The process followed these steps in the reverse order. Emissions owing to individual material-specific processes were computed and added to arrive at constituent contributions, which were again added to arrive at the carbon footprint of concrete.

Data collection Primary data was collected from 21 ongoing construction sites in Gujarat with concrete work of at least 5,000 cu m. Data collected included questionnaires through personal interviews, design of desired concrete mixes and personal observations. As the data points collected varied widely even for the same site over different points in time, the best and worst case scenarios were considered for each site. Material selection and sourcing details were used as input to the designed methodology to yield footprint values. In all, taking into account both scenarios for each site, 42 cases (21each for the best and worst case scenarios) were considered. The net footprint for an individual site was taken as an average of its scenarios. Sites were also categorised into three groups on the basis of sourcing concrete: with integrated hatching plants (C1); where concrete was supplied by commercial ready-mix concrete plants (C2); and where concrete was hatched conventionally (C3) (refer to table 1).

Analysis and inferences

Upon studying the breakup of the contribution of emissions from different constituents, it was observed that cement with 94.36 per cent contribution was the major contributor to the carbon footprint of concrete. Other factors in decreasing order were 20 mm aggregates, 10 mm aggregates, concrete transportation, sand, mixing and water - with their combined contribution being less than 6 per cent.

Regression analysis

Multivariate regression analysis was carried out for each constituent and models were developed to quantify the effects of individual variables on the footprint value: • Cement emissions = - 4398 + 906 (quantity of cement in kg) + 134 (cement distance in km) - 1.54 (quantity of cement/trip in kg)
• Emissions owing to 20 mm aggregates = 489 + 6.76 (quantity of 20 mm in kg) + 25.5 (20 mm distance in km) - 0.158 (quantity of 20 mm/trip in kg)
• Emissions owing to 10 mm aggregates = 331 + 7.95 (quantity of 10 mm in kg) + 16.2 (10 mm distance in km) - 0.13 (quantity of 10 mm/trip in kg)
• Emissions owing to sand = 346 + 1.94 (quantity of sand in kg) + 36.4 (sand distance in km) - 0.07 (quantity of sand/trip in kg) • Emissions owing to water = 112 + 19.0 (pump rating in HP) - 2.35 (batching plant capacity in cu m/hour) • Emissions owing to concrete transportation = 1,153 + 339 (concrete transportation distance)

The total footprint was taken as the sum of individual contributions and predicted values assessed for statistical significance by ensuring that the true relationship was close to the estimated relationship (as plotted with respect to 95 per cent confidence intervals).

Here are the major findings (with all other factors remaining constant): • An increase in 1 km of cement distance will result in a 134.30-gm increase in footprint (gCO2/m).
• An increase in 1 mt of 20 mm/trip will result in a 158-gm decrease in footprint (gCO2/cu m).
• An increase in 1 km of sand distance will result in a 36.40-gram increase in footprint (gCO2/cu m).
• An increase in 1 km of concrete transportation distance will result in a 339-gm increase in footprint (gCO2/m).
• The five most significant factors with respect to their effect on footprint values in decreasing order are quantity of cement, cement distance, quantity of cement per trip, quantity of 20 mm per trip and 20 mm aggregate distance.

Comparative analysis

Data from the sites surveyed was grouped under various categories to analyse variation of footprint of concrete with change in individual parameters:

Grade: The average of footprint figures for cases employing M30 grade concrete was observed to be 15.86 per cent more than the average of those employing M20 grade concrete.

Category: Irrespective of the grade of concrete used, footprint values for category C1 were observed to be the lowest and overall the footprint values in decreasing order were observed to be C3, C2 and C1. Factor: In sites where concrete was supplied from an external hatching plant, the contribution of transportation factor to concrete's footprint values was 43 per cent greater than that of sites with captive batching plants.

Effects of initiatives: Reduction in footprint values was achieved through cement replacement by flyash, as presented in Table 2.

Notable inferences

Labour and subcontractors are significantly less aware about the carbon footprint, its consequences and remedial measures. Designers are the most aware in the industry, whereas Government agencies rank worst amongst the higher awareness group. However, on absolute terms, awareness remains low. For instance, only 47.6 per cent of respondents were aware that cement was the constituent of concrete that needed to be targeted first to reduce CO2 emissions. At the pace at which construction organisations are securing orders today, it is recommended that such information not be limited to research boundaries but be included in technical codes, company manuals and method statements for wider acceptance and speedy implementation.

Conclusion

Drawing from methods adopted in different parts of the world, the study tailored a methodology to compute the carbon footprint of concrete in the local context, which was applied to data from 21 construction sites. Overall, the values were observed to be in the range of 245.90-387.46 kg CO2/m of concrete, with an average of 315.73 kg CO2/cu m. The difference in values was attributed to changes in values of individual contributing variables. The contributions of each variable and the effect of change in methods of procurement were quantified through quantitative analysis. Comparative analysis underlined the fact that refraining from overdesign, appreciating the concept of project hatching plants and replacement of cement by flyash all result in considerable cuts in footprint values. In future, spreading awareness of the environmental benefits of such measures will go a long way.

Reduce concrete footprint by:

• Innovative structural design approaches to minimise consumption of concrete.
• Higher use of blended cements and application of high volume flyash (HVFA) concrete.
• Changes in specifications to be based on performance rather than prescription.

About the author: Sunny Goklani has studied with CEPT University, School of Building Science and Technology.

Share your construction material with us at feedback@ASAPPmedia.com
The construction industry's contribution to total anthropogenic greenhouse gas emissions is estimated at about 8 per cent, with cement being one of the highest emitters. SUNNY GOKLANI analyses the values of its carbon footprint. Here's one footprint that will be hard to erase. The atmospheric concentration of carbon dioxide (CO2), which makes up about 77 per cent of anthropogenic greenhouse gas (GHG), was recorded at an unprecedented 392 ppm (parts per million) by volume in 2011, the highest in the past 20 million years. The green lining: India, the fifth largest emitter, has announced that it will aim to reduce the emissions intensity of its GDP by 20-25 per cent from 2005 levels by 2020. However, with a building material like cement being the largest contributor to emissions from construction, it is imperative to understand its carbon footprint. Past research Actual calculations for the carbon footprint of concrete have only been published in the US and Europe. According to a study conducted at the Danish Technological Institute in 2008, cement accounted for almost 90 per cent of emissions while the remaining 10 per cent came from transportation and other constituents. In terms of footprint values, the range was observed from 0.12 kg CO2/kg of concrete with lower grades up to around 0.20 CO2/kg for higher grades of concrete. Suggested average in terms of CO2 density from the study was given as: 402 kg CO2/cu m of concrete. The study Findings from studies to compute the carbon footprint of concrete carried geographical limitations owing to the heterogeneous nature of concrete. Thus, this study aimed to identify and enumerate factors contributing to emissions in the production of concrete and compute the carbon footprint of concrete per cu m, and to study relationships amongst contributing factors. The scope of the study was confined to CO2 emissions from activities in production of concrete ranging from production of raw materials up to the mixing site, except reinforcement grades of concrete studied were M20 and M30. Case studies were geographically limited to Gujarat and suggestions limited to the Indian context. Footprint computing methodology The carbon footprint of concrete was taken as the sum total of footprints owing to individual contributions from its constituents and generic processes. Carbon emissions for each individual constituent was taken again as a sum of emissions from various material-specific processes that went into the lifecycle of the constituent until it was ready to be mixed. Emissions from each material-specific process were calculated through converting inputs from processing terms to emission equivalents, by employing conversion factors obtained through secondary data collection. The process followed these steps in the reverse order. Emissions owing to individual material-specific processes were computed and added to arrive at constituent contributions, which were again added to arrive at the carbon footprint of concrete. Data collection Primary data was collected from 21 ongoing construction sites in Gujarat with concrete work of at least 5,000 cu m. Data collected included questionnaires through personal interviews, design of desired concrete mixes and personal observations. As the data points collected varied widely even for the same site over different points in time, the best and worst case scenarios were considered for each site. Material selection and sourcing details were used as input to the designed methodology to yield footprint values. In all, taking into account both scenarios for each site, 42 cases (21each for the best and worst case scenarios) were considered. The net footprint for an individual site was taken as an average of its scenarios. Sites were also categorised into three groups on the basis of sourcing concrete: with integrated hatching plants (C1); where concrete was supplied by commercial ready-mix concrete plants (C2); and where concrete was hatched conventionally (C3) (refer to table 1). Analysis and inferences Upon studying the breakup of the contribution of emissions from different constituents, it was observed that cement with 94.36 per cent contribution was the major contributor to the carbon footprint of concrete. Other factors in decreasing order were 20 mm aggregates, 10 mm aggregates, concrete transportation, sand, mixing and water - with their combined contribution being less than 6 per cent. Regression analysis Multivariate regression analysis was carried out for each constituent and models were developed to quantify the effects of individual variables on the footprint value: • Cement emissions = - 4398 + 906 (quantity of cement in kg) + 134 (cement distance in km) - 1.54 (quantity of cement/trip in kg) • Emissions owing to 20 mm aggregates = 489 + 6.76 (quantity of 20 mm in kg) + 25.5 (20 mm distance in km) - 0.158 (quantity of 20 mm/trip in kg) • Emissions owing to 10 mm aggregates = 331 + 7.95 (quantity of 10 mm in kg) + 16.2 (10 mm distance in km) - 0.13 (quantity of 10 mm/trip in kg) • Emissions owing to sand = 346 + 1.94 (quantity of sand in kg) + 36.4 (sand distance in km) - 0.07 (quantity of sand/trip in kg) • Emissions owing to water = 112 + 19.0 (pump rating in HP) - 2.35 (batching plant capacity in cu m/hour) • Emissions owing to concrete transportation = 1,153 + 339 (concrete transportation distance) The total footprint was taken as the sum of individual contributions and predicted values assessed for statistical significance by ensuring that the true relationship was close to the estimated relationship (as plotted with respect to 95 per cent confidence intervals). Here are the major findings (with all other factors remaining constant): • An increase in 1 km of cement distance will result in a 134.30-gm increase in footprint (gCO2/m). • An increase in 1 mt of 20 mm/trip will result in a 158-gm decrease in footprint (gCO2/cu m). • An increase in 1 km of sand distance will result in a 36.40-gram increase in footprint (gCO2/cu m). • An increase in 1 km of concrete transportation distance will result in a 339-gm increase in footprint (gCO2/m). • The five most significant factors with respect to their effect on footprint values in decreasing order are quantity of cement, cement distance, quantity of cement per trip, quantity of 20 mm per trip and 20 mm aggregate distance. Comparative analysis Data from the sites surveyed was grouped under various categories to analyse variation of footprint of concrete with change in individual parameters: Grade: The average of footprint figures for cases employing M30 grade concrete was observed to be 15.86 per cent more than the average of those employing M20 grade concrete. Category: Irrespective of the grade of concrete used, footprint values for category C1 were observed to be the lowest and overall the footprint values in decreasing order were observed to be C3, C2 and C1. Factor: In sites where concrete was supplied from an external hatching plant, the contribution of transportation factor to concrete's footprint values was 43 per cent greater than that of sites with captive batching plants. Effects of initiatives: Reduction in footprint values was achieved through cement replacement by flyash, as presented in Table 2. Notable inferences Labour and subcontractors are significantly less aware about the carbon footprint, its consequences and remedial measures. Designers are the most aware in the industry, whereas Government agencies rank worst amongst the higher awareness group. However, on absolute terms, awareness remains low. For instance, only 47.6 per cent of respondents were aware that cement was the constituent of concrete that needed to be targeted first to reduce CO2 emissions. At the pace at which construction organisations are securing orders today, it is recommended that such information not be limited to research boundaries but be included in technical codes, company manuals and method statements for wider acceptance and speedy implementation. Conclusion Drawing from methods adopted in different parts of the world, the study tailored a methodology to compute the carbon footprint of concrete in the local context, which was applied to data from 21 construction sites. Overall, the values were observed to be in the range of 245.90-387.46 kg CO2/m of concrete, with an average of 315.73 kg CO2/cu m. The difference in values was attributed to changes in values of individual contributing variables. The contributions of each variable and the effect of change in methods of procurement were quantified through quantitative analysis. Comparative analysis underlined the fact that refraining from overdesign, appreciating the concept of project hatching plants and replacement of cement by flyash all result in considerable cuts in footprint values. In future, spreading awareness of the environmental benefits of such measures will go a long way. Reduce concrete footprint by: • Innovative structural design approaches to minimise consumption of concrete. • Higher use of blended cements and application of high volume flyash (HVFA) concrete. • Changes in specifications to be based on performance rather than prescription. About the author: Sunny Goklani has studied with CEPT University, School of Building Science and Technology. Share your construction material with us at feedback@ASAPPmedia.com

Next Story
Infrastructure Transport

JNPA Becomes First Indian Port to Cross 10 Million TEU Capacity

The Jawaharlal Nehru Port Authority (JNPA), located at Uran in Navi Mumbai, has become the first port in India to achieve over 10 million TEUs (twenty-foot equivalent units) in container handling capacity.With the recent expansion, the port now operates five container terminals with a combined capacity of 10.4 million TEUs, alongside two liquid and two general cargo terminals.Handling more than half of India’s container traffic, JNPA processed 7.05 million TEUs in 2024 and has moved 15.39 million tonnes of containers and 16.64 million tonnes of total cargo in the first two months of FY 2025â..

Next Story
Infrastructure Transport

Nod for Rs. 36.26 billion Expansion of Pune Metro Line 2

The Union Cabinet has approved the Rs.36.26 billion expansion of Pune Metro Line 2, adding 12.75 km of track and 13 new stations to improve east–west connectivity across the city.The project aims to link Pune’s urban core with rapidly growing suburbs, supporting the city’s rising demand for efficient and sustainable transport solutions. This expansion is part of Corridor 2 of the Pune Metro and includes two key routes: Vanaz to Chandani Chowk (Corridor 2A) and Ramwadi to Wagholi/Vitthalwadi (Corridor 2B).It will connect residential, IT, and educational hubs in areas such as Bavdhan, Koth..

Next Story
Infrastructure Transport

Assembly begins for ‘Nayak’ TBM on Thane– Borivali Twin Tunnel Project

The assembly of ‘Nayak’, the first of four Tunnel Boring Machines (TBMs) for the Thane–Borivali Twin Tube Tunnel Project, has commenced at the Thane site. Built by German firm Herrenknecht AG and deployed by Megha Engineering & Infrastructure (MEIL), the TBM marks a key milestone in Mumbai’s ambitious 11.8-km underground road corridor beneath Sanjay Gandhi National Park.The twin tunnels will reduce the Thane–Borivali travel distance by 12 km and decongest Thane Ghodbunder Road. ‘Nayak’, with a 13.2-metre diameter, is designed to bore through challenging geological conditions ..

Advertisement

Advertisement

Subscribe to Our Newsletter

Get daily newsletters around different themes from Construction world.

STAY CONNECTED

Advertisement

Advertisement

Advertisement

Advertisement

Talk to us?