Will current players manage growth? Will past issues come back to haunt these players?
Real Estate

Will current players manage growth? Will past issues come back to haunt these players?

A saga of twists and turns

India’s road sector has seen its share of twists and turns over the past decade. It has meandered from a high of build-operate-transfer (BOT) awards in 2010, to a low of land acquisition hurdles and abysmal private sector participation in 2014, only to be uplifted by the introduction of newer modes such as the hybrid annuity model (HAM) in 2016, and the highest-ever award of 7,400 km by the National Highways Authority of India (NHAI) in 2018.

Cut to now, and the sector seems to once again be facing many roadblocks – slowdown in awards, delays in execution owing to postponement of appointed dates, slow pace of land acquisition, and elusive financial closures. Seems like déjà vu. The key questions to be addressed is whether history is repeating itself and could we see distress in the sector similar to that observed in the 2013 and 2015 period.

Methodology
To answer these questions, CRISIL has analysed the financials of dominant road developers between the two time periods (2010-2015 and 2015-2020) and studied their performance trend through key financial indicators as mentioned below:

  • Revenue – an indicator of scale of operations, represented by size of bubble
  • Investments in project SPVs as a percentage of their net worth – an indicator of proportion of capital locked in project SPVs represented on X axis
  • Total outside liabilities to tangible net worth (TOL/TNW) – an indicator of leverage represented on Y axis.
  • Bubbles of the same colour in both the graphs represent the performance of same developer in the two time periods mentioned above.

    What happened between 2010 and 2015?


    Source: CRISIL Ratings

    The two charts above show a comparison of the dominant road developers between fiscals 2010 and 2015, and their aggression in the BOT era which led to high equity commitments and leveraging of balance sheets.

    In fiscal 2010,the top seven developers by revenue had less than 100 per cent of net worth as investments in their project SPVs and TOL/TNW for most of them were less than two times (Chart 1). With significant awarding done in BOT mode over time, these players competed aggressively to grab opportunities to scale up. These players won significant orders which were to be executed in BOT mode. This required them to meet high equity requirements, which they did by leveraging.

    So, by fiscal 2015, equity investments in the project SPVs increased to 200-300 per cent of their net worth in the SPVs and deterioration of financial metrics with TOL/TNW crossing beyond four times for most players (Chart 2) while their revenue remained stagnant.

    With land acquisition and clearances being bottlenecks in majority of these projects, these players struggled to complete the projects, resulting in time and cost overruns, without sufficient accruals to keep the leverage in check. This resulted in many players getting into financial distress and therefore their ability to bid for new projects was severely constrained, making room for the next line of players in the sector.

    Emergence of New Players


    Source: CRISIL Ratings

    After 2015, when many large players went into financial distress, the sector saw the emergence of the next tier of players on the centre stage. These were primarily engineering, procurement and construction (EPC) companies, with smaller scale and without much, or with limited, exposure to BOT risks. They had smaller but healthier balance sheets, and had stayed away from the BOT bidding in the past.

    CRISIL has analysed top ten players (by revenue) post fiscal 2015.
    In fiscal 2015, seven out of these ten developers maintained less than 100 per cent of net worth as investments in their project SPVs and TOL/TNW for most of them were less than 1.5 times (Chart 3)indicating a low leverage and healthy capital structure. With increase in awarding and NHAI’s focus on EPC and HAM mode, these players were able to win projects basis their strong execution skills.

    So, by fiscal 2020, most of these developers are estimated to triple their scale without significantly leveraging their balance sheet. Nine out of ten developers would have comfortable leverage with TOL/TNW of less than 1.5 times and investments less than 100 per cent of their net worth in the SPVs despite significant ramp up in size (Chart 4).

    What supported these players?
    A five-year comparison of these developers, shows a significant scale-up in size (almost tripling), while maintaining a healthy balance sheets. The below mentioned factors supported their credit profile

    1. The NHAI’s change in awarding model to largely EPC and HAM projects
    2. NHAI’s focus on clearing bottlenecks such as land acquisition issues and clearances. Further, appointed date for HAM projects is declared only once 80% of land is made available.
    3. Given that the capital requirement in EPC and HAM projects is lower than that of BOT, these developers were able to sustain their healthy balance sheet and kept a check on their debt levels while pursuing growth.
    4. Further, increased private equity interest in the sector and the philosophy of these developers to unlock their capital and remain asset-light has also benefited them.
    Accordingly the credit profile of most these dominant players has sustained given their focus on execution, philosophy around low leverage and stance to sell the assets even during construction. Further, interest from global funds will continue to give a fillip to the sector.

    Way Forward
    While the expected slowdown in awarding is likely to significantly moderate the topline growth of EPC developers from a high of almost 30% in fiscal 2019 to around 10% in the near term, we expect the credit profiles of CRISIL-rated companies to remain healthy. The ability of these developers to rein in bidding aggression especially if the BOT mode is re-introduced will be the key monitorable.

    The NHAI’s focus on land acquisition and confirmation of appointed dates for projects only after 80% of land is acquired are positives that would ensure stalled projects are minimised. Further, lenders not disbursing debt until land is in place and paid for ensures credit discipline. Ability of these players to monetise the completed projects which would free up the capital and ensure liquidity to bid for new projects will be the key to healthy balance sheets. Continued stake sales and investor interest, as seen in the past few years will be a key monitorable.

    The issues of the past have thus been lessons well learnt for the present and will continue to be a guidance for the future credit health of the sector.

    A saga of twists and turns India’s road sector has seen its share of twists and turns over the past decade. It has meandered from a high of build-operate-transfer (BOT) awards in 2010, to a low of land acquisition hurdles and abysmal private sector participation in 2014, only to be uplifted by the introduction of newer modes such as the hybrid annuity model (HAM) in 2016, and the highest-ever award of 7,400 km by the National Highways Authority of India (NHAI) in 2018. Cut to now, and the sector seems to once again be facing many roadblocks – slowdown in awards, delays in execution owing to postponement of appointed dates, slow pace of land acquisition, and elusive financial closures. Seems like déjà vu. The key questions to be addressed is whether history is repeating itself and could we see distress in the sector similar to that observed in the 2013 and 2015 period. Methodology To answer these questions, CRISIL has analysed the financials of dominant road developers between the two time periods (2010-2015 and 2015-2020) and studied their performance trend through key financial indicators as mentioned below: Revenue – an indicator of scale of operations, represented by size of bubble Investments in project SPVs as a percentage of their net worth – an indicator of proportion of capital locked in project SPVs represented on X axis Total outside liabilities to tangible net worth (TOL/TNW) – an indicator of leverage represented on Y axis. Bubbles of the same colour in both the graphs represent the performance of same developer in the two time periods mentioned above. What happened between 2010 and 2015? Source: CRISIL Ratings The two charts above show a comparison of the dominant road developers between fiscals 2010 and 2015, and their aggression in the BOT era which led to high equity commitments and leveraging of balance sheets. In fiscal 2010,the top seven developers by revenue had less than 100 per cent of net worth as investments in their project SPVs and TOL/TNW for most of them were less than two times (Chart 1). With significant awarding done in BOT mode over time, these players competed aggressively to grab opportunities to scale up. These players won significant orders which were to be executed in BOT mode. This required them to meet high equity requirements, which they did by leveraging. So, by fiscal 2015, equity investments in the project SPVs increased to 200-300 per cent of their net worth in the SPVs and deterioration of financial metrics with TOL/TNW crossing beyond four times for most players (Chart 2) while their revenue remained stagnant. With land acquisition and clearances being bottlenecks in majority of these projects, these players struggled to complete the projects, resulting in time and cost overruns, without sufficient accruals to keep the leverage in check. This resulted in many players getting into financial distress and therefore their ability to bid for new projects was severely constrained, making room for the next line of players in the sector. Emergence of New Players Source: CRISIL Ratings After 2015, when many large players went into financial distress, the sector saw the emergence of the next tier of players on the centre stage. These were primarily engineering, procurement and construction (EPC) companies, with smaller scale and without much, or with limited, exposure to BOT risks. They had smaller but healthier balance sheets, and had stayed away from the BOT bidding in the past. CRISIL has analysed top ten players (by revenue) post fiscal 2015. In fiscal 2015, seven out of these ten developers maintained less than 100 per cent of net worth as investments in their project SPVs and TOL/TNW for most of them were less than 1.5 times (Chart 3)indicating a low leverage and healthy capital structure. With increase in awarding and NHAI’s focus on EPC and HAM mode, these players were able to win projects basis their strong execution skills. So, by fiscal 2020, most of these developers are estimated to triple their scale without significantly leveraging their balance sheet. Nine out of ten developers would have comfortable leverage with TOL/TNW of less than 1.5 times and investments less than 100 per cent of their net worth in the SPVs despite significant ramp up in size (Chart 4). What supported these players? A five-year comparison of these developers, shows a significant scale-up in size (almost tripling), while maintaining a healthy balance sheets. The below mentioned factors supported their credit profile 1. The NHAI’s change in awarding model to largely EPC and HAM projects 2. NHAI’s focus on clearing bottlenecks such as land acquisition issues and clearances. Further, appointed date for HAM projects is declared only once 80% of land is made available. 3. Given that the capital requirement in EPC and HAM projects is lower than that of BOT, these developers were able to sustain their healthy balance sheet and kept a check on their debt levels while pursuing growth. 4. Further, increased private equity interest in the sector and the philosophy of these developers to unlock their capital and remain asset-light has also benefited them. Accordingly the credit profile of most these dominant players has sustained given their focus on execution, philosophy around low leverage and stance to sell the assets even during construction. Further, interest from global funds will continue to give a fillip to the sector. Way Forward While the expected slowdown in awarding is likely to significantly moderate the topline growth of EPC developers from a high of almost 30% in fiscal 2019 to around 10% in the near term, we expect the credit profiles of CRISIL-rated companies to remain healthy. The ability of these developers to rein in bidding aggression especially if the BOT mode is re-introduced will be the key monitorable. The NHAI’s focus on land acquisition and confirmation of appointed dates for projects only after 80% of land is acquired are positives that would ensure stalled projects are minimised. Further, lenders not disbursing debt until land is in place and paid for ensures credit discipline. Ability of these players to monetise the completed projects which would free up the capital and ensure liquidity to bid for new projects will be the key to healthy balance sheets. Continued stake sales and investor interest, as seen in the past few years will be a key monitorable. The issues of the past have thus been lessons well learnt for the present and will continue to be a guidance for the future credit health of the sector.

    Next Story
    Real Estate

    Della, Hiranandani & Krisala unveil Rs 11 billion themed township in Pune

    In a first-of-its-kind initiative, Della Resorts & Adventure has partnered with Hiranandani Communities and Krisala Developers to develop a Rs 11 billion racecourse-themed township in North Hinjewadi, Pune. Based on Della’s proprietary CDDMO™ model, the hospitality-led, design-driven project aims to deliver up to 9 per cent returns—significantly higher than the typical 3 per cent in residential real estate.Spanning 40 acres within a 105-acre master plan, the mega township will feature an 8-acre racecourse and international polo club, 128 private villa plots, 112 resort residences, a ..

    Next Story
    Real Estate

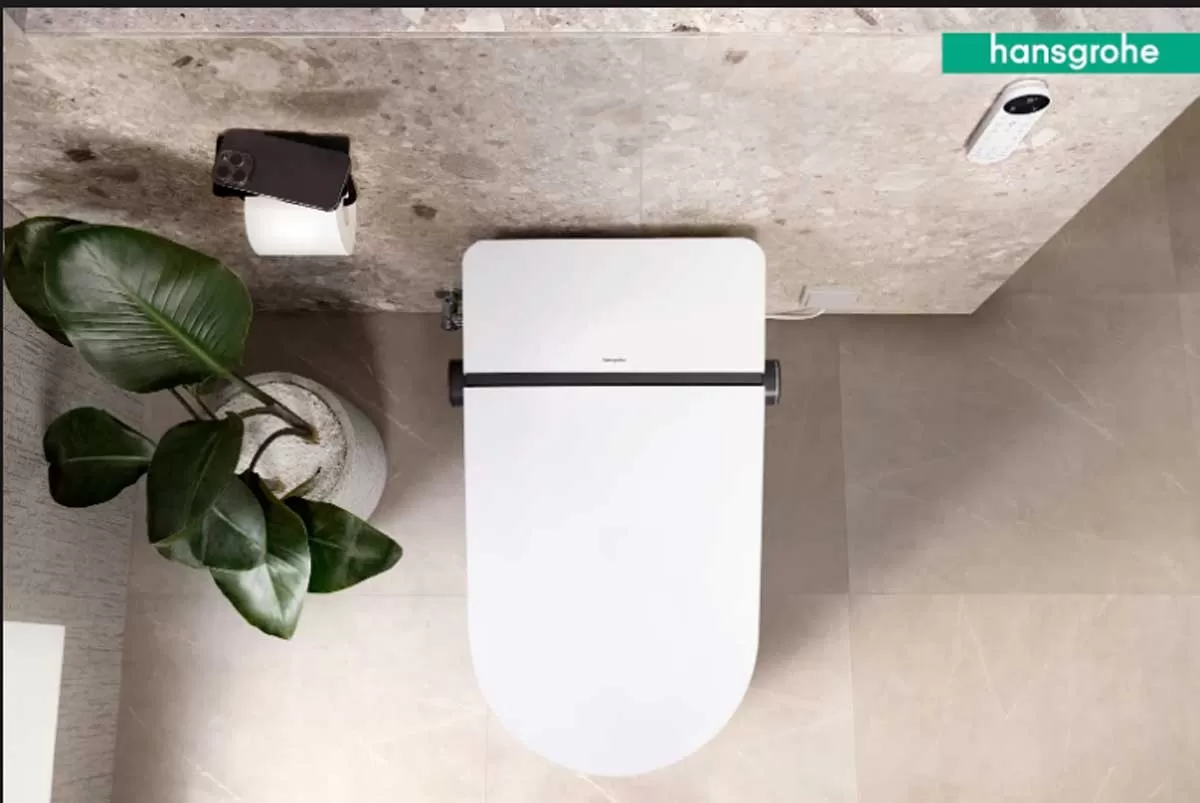
    Hansgrohe unveils LavaPura Element S e-toilets in India

    Hansgrohe India has launched its latest innovation, the LavaPura Element S e-toilet series, introducing a new standard in hygiene-focused, smart bathroom solutions tailored for Indian homes and high-end hospitality spaces.Blending German engineering with minimalist aesthetics, the LavaPura Element S combines intuitive features with advanced hygiene technology. The series is designed for easy installation and optimal performance under Indian conditions, reinforcing the brand’s focus on functional elegance and modern convenience.“With evolving consumer preferences, smart bathrooms are no lon..

    Next Story
    Infrastructure Urban

    HCC Net Profit Stands at Rs 2.28 Billion for Q4 FY25

    Hindustan Construction Company (HCC) reported a standalone net profit of Rs 2.28 billion in Q4 FY25, a sharp increase from Rs 388 million in Q4 FY24. Standalone revenue for the quarter stood at Rs 13.30 billion, compared to Rs 14.28 billion in Q4 FY24. For the full fiscal year, the company reported a standalone net profit of Rs 849 million, down from Rs 1.79 billion in FY24. Standalone revenue for FY25 was Rs 48.01 billion, compared to Rs 50.43 billion in the previous year.Consolidated revenue for Q4 FY25 stood at Rs 13.74 billion, and for FY25 at Rs 56.03 billion, down from Rs 17.73 billion i..

    Advertisement

    Advertisement

    Subscribe to Our Newsletter

    Get daily newsletters around different themes from Construction world.

    STAY CONNECTED

    Advertisement

    Advertisement

    Advertisement

    Advertisement

    Talk to us?