
LNG, containers dominate 50% of the global ship orderbook
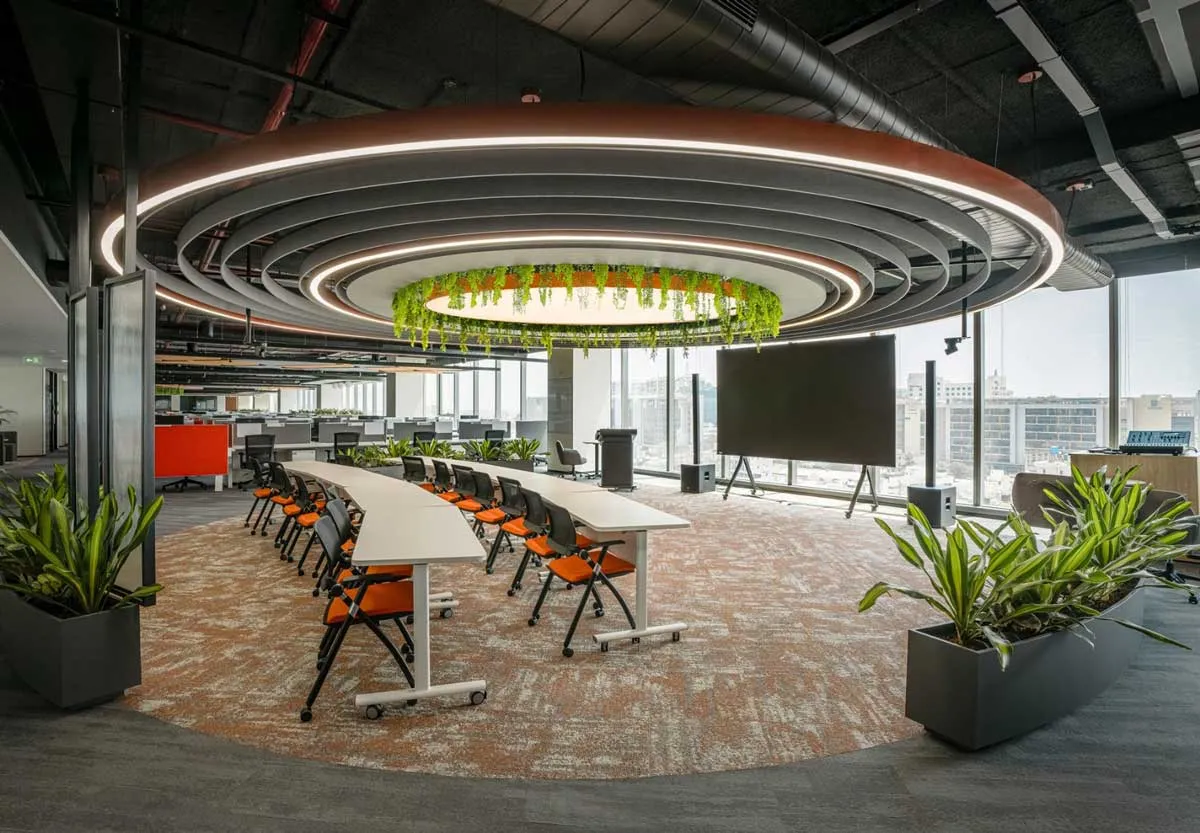
AI: The New Recruit
From getting ideas to evaluating designs, presenting concepts to clients and tracking projects, artificial intelligence (AI) is helping architects work better and faster.“AI allows architects to spend more time doing what only they can do: think critically, synthesise complexity and design with intent,” says Dikshu C Kukreja, Managing Principal, CP Kukreja Architects. “Every minute reclaimed from repetitive processes can be invested in creativity, contextual understanding, interdisciplinary collaboration and innovation – the qualities that define meaningful architecture.”To read the ..
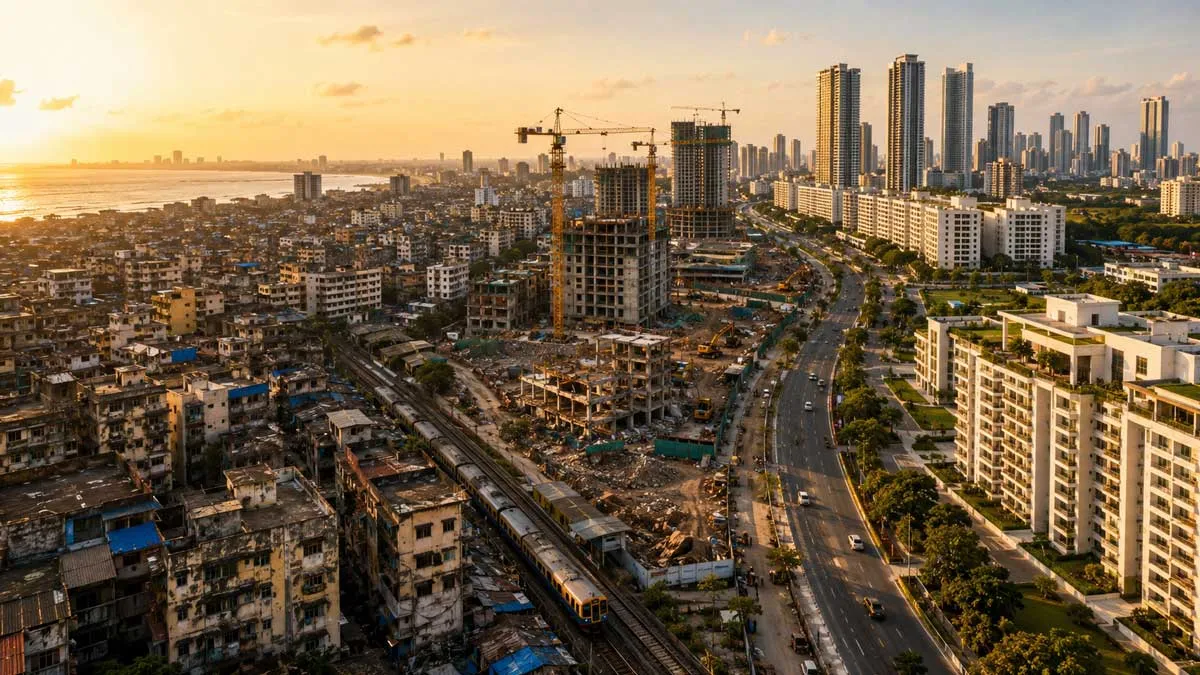
Redevelopment 2.0
In 2017, Mumbai identified 160,000 ageing buildings due for structural audit. Close to half of these were in the Western Suburbs. Redeveloping the oldest and structurally weakest of these would help unlock new housing, much needed given the city’s growing population density and constant developed area of 437.7 sq km. At 30,600 people per sq km in 2024, Mumbai’s density was almost thrice that of Gurugram, and 60 per cent higher than Bengaluru’s.Essentially, Mumbai’s realty market has demand. It has capital. It has realty development potential.Fast forward to 2026. Mumbai has 1,094 regis..

Cost intelligence will become a strategic contributor to project success
As India's construction industry accelerates its digital transformation, integrated platforms, AI and connected data are becoming essential to improving cost certainty, project efficiency and sustainability. Ravi Kumar, Sales Director – India, RIB Software India, shares how digital workflows are reshaping project planning, commercial management and decision-making across the construction value chain.India's construction sector is embracing digital technologies at an unprecedented pace. From your perspective, what are the biggest shifts driving this transformation and how is RIB Software enab..
Latest Updates