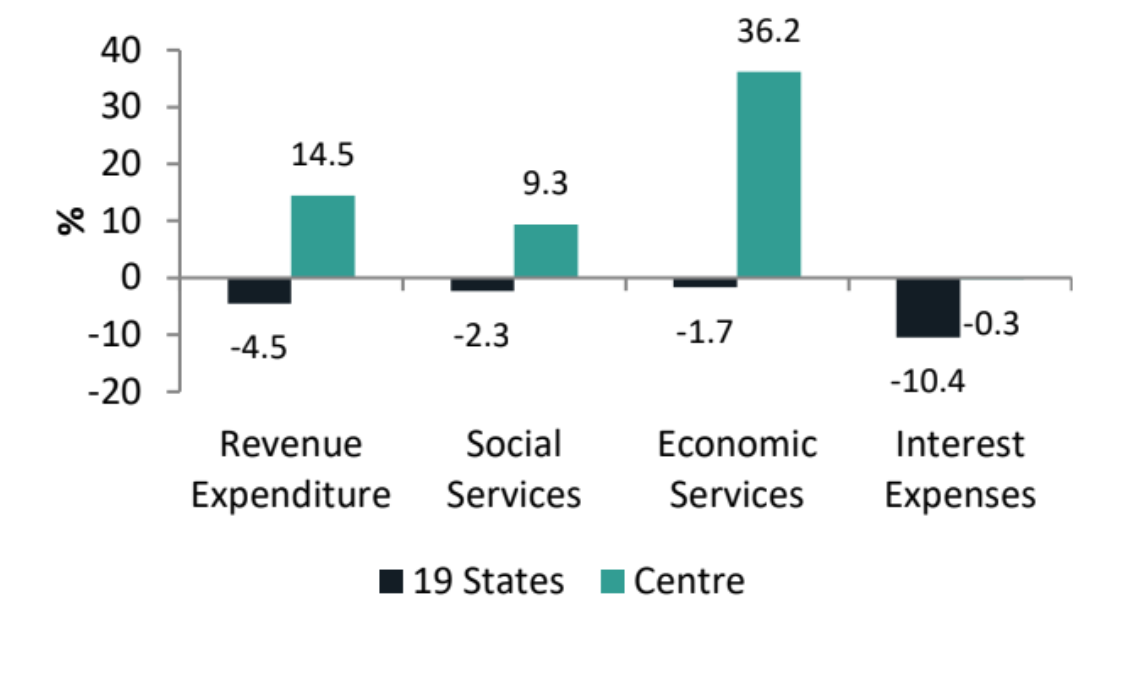
Govt upped capital and revenue spend in FY21: CARE Ratings

IHC and Adani to Invest US$11.5 bn in Odisha Aluminium Project
Abu Dhabi's International Holding Company (IHC) will invest US$11.5 bn in an integrated aluminium project in the eastern Indian state of Odisha in a joint venture with the Adani Group, a state official said. The official said the announcement represented the country's largest foreign investment in mining and metallurgy. Officials said the venture would span both mining and metallurgical activities across several facilities in the state. The project has been described as integrated, encompassing upstream bauxite extraction and downstream smelting and metallurgy, and is intended to develop a com..

Air India and SIAEC to Explore MRO Joint Venture in India
Air India and SIA Engineering Company (SIAEC) have signed a memorandum of understanding (MoU) to explore the formation of a maintenance, repair and overhaul joint venture in India. The MoU, signed on Friday, will examine collaboration to develop India as a global aviation MRO hub and to serve growing needs across the Indian and regional markets. SIA Engineering Company, part of the Singapore Airlines Group which holds a 25.1 per cent stake in Air India, will bring technical expertise alongside Air India's established airline operations network. The partnership builds on existing cooperation be..

Assam and Centre Review Aviation Projects Push Silchar Airport Approval
Assam and the Centre on Thursday, July two reviewed a series of aviation infrastructure projects aimed at strengthening air connectivity across the state, with the proposed greenfield airport at Silchar emerging as a key priority. The review formed part of broader efforts to position Assam as a major aviation and logistics hub for the north east. Officials outlined timelines and preparatory work that they said would guide the next stages of project approvals. The Chief Minister met the Union Civil Aviation Minister at Rajiv Gandhi Bhavan in New Delhi and described the meeting as very productiv..
Latest Updates