GDP growth in Q3 shows V-shaped growth
ECONOMY & POLICY

GDP growth in Q3 shows V-shaped growth

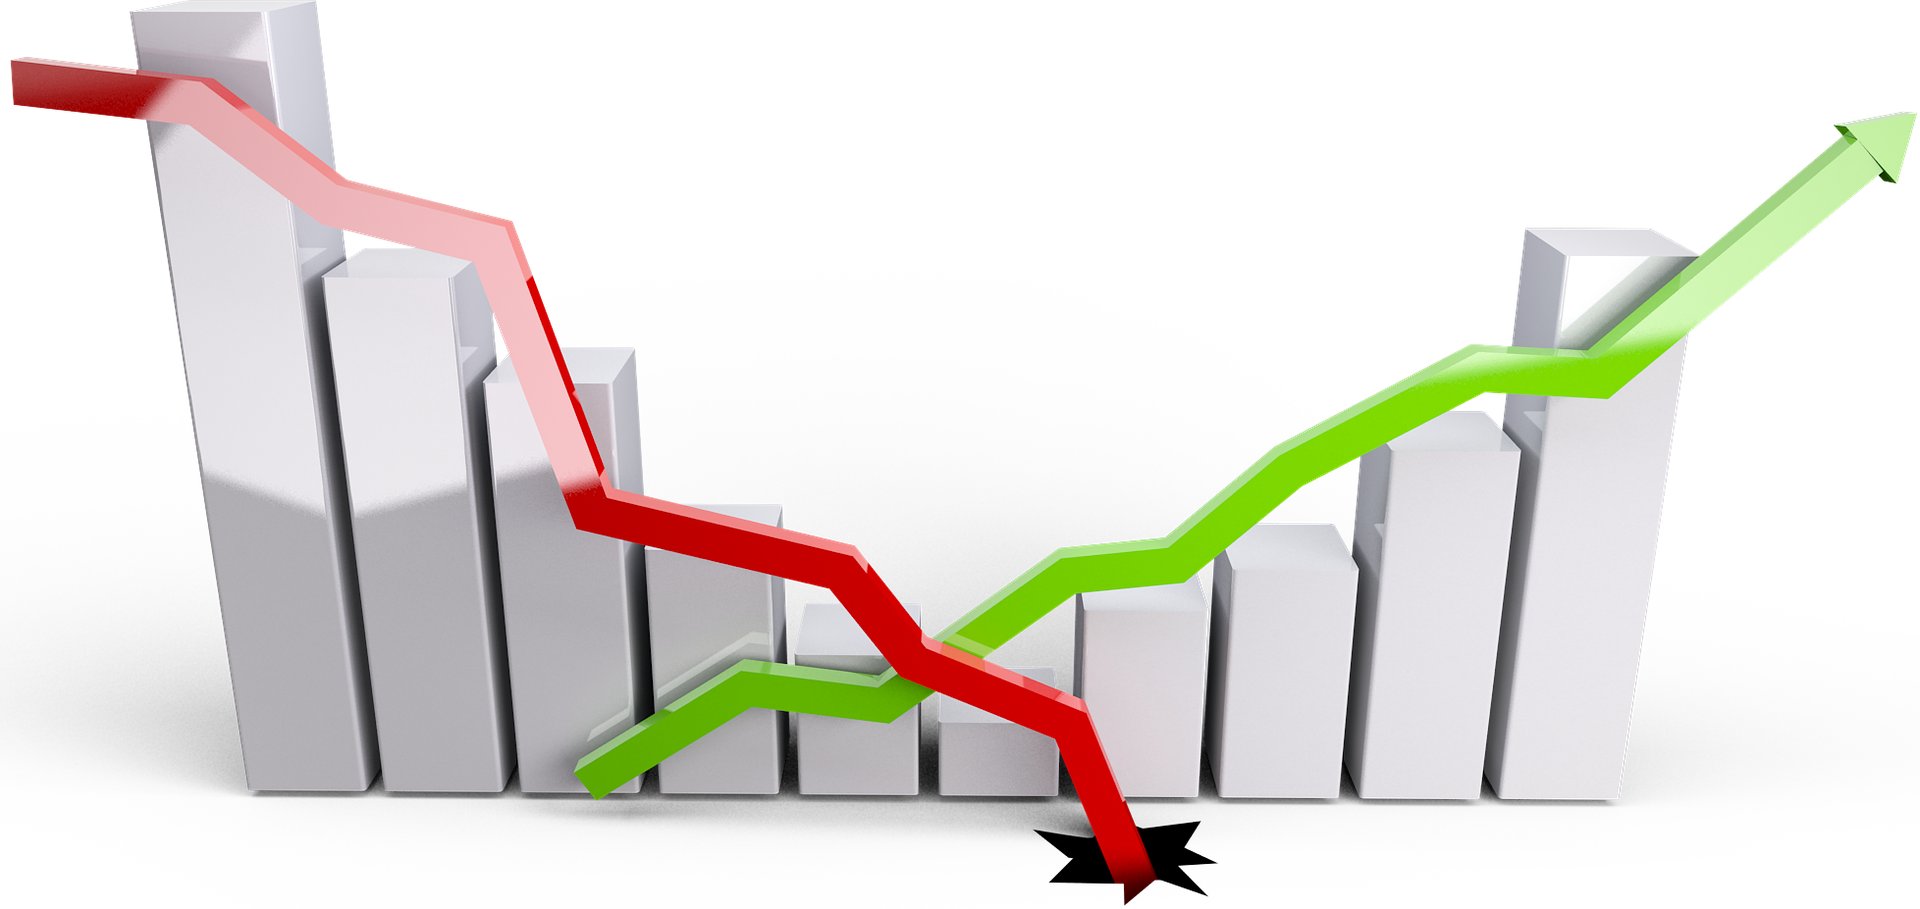
The Indian economy emerged from recession and returned to growth in the quarter of October-December 2020, following two successive quarters of contraction in growth. The Indian economy grew by 0.4% in the third quarter of FY21, which is a sharp improvement from the negative growth of 24.4% and 7.3% in the preceding two quarters. CARE Ratings estimate for GDP growth for the quarter was in the range of -0.5% to -1.5%.

India is one of the select few economies that have witnessed positive growth in the three month period October-December 2020.

This gives credence to the general expectation of a quick revival in the domestic economy and this has led to the government revising upwards it growth estimate for gross value added for FY21 from -7.2% (first advance estimate) to -6.5% (second advance estimate). The GDP estimate for FY21 however has been revised downwards from the earlier estimate of - 7.7% to -8.0%. This is due to the lower incidence of taxes as well as higher subsidies which has been revised downwards from -13% to -23%. There has also been a downward revision in the Q1 FY21 GDP (from -23.9% to -24.4%) and upward revision in that of Q2 FY21 (from -7.5% to -7.3%).

The unlocking of the economy with the steady decline in Covid-19 infection during the period (Oct-Dec) boosted consumption and activity across sectors. The gains in the Indian economy during the October-December’20 period were driven by growth in agriculture, manufacturing, electricity, gas, water & utility services, construction and financial, real estate and professional services.

Both consumption (private and government) and investments have recorded a growth (y-o--y) during Q3 FY21, reversing the decline of the preceding two quarters. Despite the improvements, the growth rates are notably lower than that a year ago. The real GDP growth in Q3 FY21 at 0.4% is notably lower than the 3.3% growth of Q3 FY20.

The data given below shows the y-o--y GDP growth:


Sector-wise performance in Q3 2020-21 (year-on-year)

• The agriculture and industrial sector witnessed growth, while the contact intensive services sectors registered negative growth.
• The industrial sector has witnessed a growth of 2.7% aided by the growth in manufacturing (1.6%), electricity, gas, water & utility services (7.3%) and construction (6.2%). Manufacturing sector output returned to growth after a gap of four quarters while that a construction turned positive after three quarters, reflective of the higher levels of activity in these segments with the unlocking process. The favourable base effect has also aided the growth in these segments
• Agriculture sector grew by 3.9% in Q3 FY21 over the 3% growth of year ago. • The contraction in the services sector eased from an average 16% in the preceding two quarters to -1.0% during OctoberDecember’20
• The core GVA growth, which excludes the agriculture and government sector was 0.7 % in Q3 FY21 against the 1.0% growth in overall GVA, indicating the higher contribution of the industrial and services segment in the improvements in the GVA.
• The trade, hotel and transport segment registered the highest contraction amongst the sectors during October-December at (-)7.7%.
• Public administration, defence and other services saw growth contract by -1.5% in Q3 FY21. There was however an improvement from the contraction of over 9% in the preceding two quarters reflective of the higher spending being undertaken by the government during the quarter gone by.

Sector-wise growth highlights agricultural and industrial growth, the table given below shows the sectoral growth:


Agriculture, forestry & fishing 

Q3 FY17 

7.4 

Q3 FY18 Q3FY19 

Q3 FY20 Q3 FY21

5.1 

2.0 

3.4 

3.9

Industry 

8.2 

7.7 

5.0 

-2.5 

2.7

Mining & quarrying 

9.1 

4.7 

-4.4 

-3.5 

-5.9

Manufacturing 

8.3 

9.3 

5.2 

-2.9 

1.6

Electricity, gas ,water supply & other utility services 

10.2 

10.1 

9.5 

-3.1 

7.3

Construction 

7.4 

4.7 

6.6 

-1.3 

6.2

Services 

7.2 

7.5 

7.4 

6.0 

-1.0

Trade, hotels, transport, communication &  broadcasting 

7.9 

8.2 

7.8 

7.0 

-7.7

Financial, real estate & professional services 

5.2 

5.7 

6.5 

5.5 

6.6

Public administration, defence and other services 

9.1 

8.9 

8.1 

8.9 

-1.5

GVA at Basic Price 

7.5 

7.1 

5.6 

3.4 

1.0

Core GVA(excluding agri & public administration) 

7.3 

7.3 

6.2 

2.3 

0.7

Source: MOSPI


Consumption and Investments (y-o-y growth )

• There has been a pick- up in consumption – both government and private consumption in the October-December period.
• Private consumption which is driver of the economy (accounting for 60% of the GDP) witnessed a growth of 1% in Q3 FY21 Although significantly lower than the 11% growth in Q3 FY20, it is a notable improvement form the growth of (-)25% in Q1 FY21 and (-)8% in Q2 FY21.
• Government consumption too witnessed an improvement, growing by nearly 7% in Q3 FY21 from year ago.
• Investment’s too have picked up, registering year-on-year growth after a gap of three quarters . Investments measured as Gross Fixed Capital Formation (GCFC) grew by of 6% in Q3 FY21 v/s the 1.4% growth in Q3 FY20.

The growth in consumption and investment rates as % of GDP is highlighted in the graph given below:

Growth in Expenditure of GDP (current prices) as YoY % change is highlighted in the table given below:

 Growth in Expenditure of GDP (current prices) – YoY (% change) 

GFCE 

Q3 FY17 

10.0 

Q3 FY18 Q3FY19 

Q3 FY20 

Q3 FY21 

7.24

15.4 

6.9 

14.0 

PFCE 

14.9 

9.8 

10.8 

11.0 

1.03

GFCF 

7.9 

14.8 

16.7 

1.4 

5.91

Exports 

9.7 

9.9 

20.3 

-2.0 

8.38

Imports 

11.8 

14.4 

22.2 

-10.2 

-1.96

GDP (at  

current prices) 

11.5 

11.6 

12.5 

6.5 

5.3

Source: MOSPI  


Adapted from CARE Ratings analysis.
The Indian economy emerged from recession and returned to growth in the quarter of October-December 2020, following two successive quarters of contraction in growth. The Indian economy grew by 0.4% in the third quarter of FY21, which is a sharp improvement from the negative growth of 24.4% and 7.3% in the preceding two quarters. CARE Ratings estimate for GDP growth for the quarter was in the range of -0.5% to -1.5%. India is one of the select few economies that have witnessed positive growth in the three month period October-December 2020. This gives credence to the general expectation of a quick revival in the domestic economy and this has led to the government revising upwards it growth estimate for gross value added for FY21 from -7.2% (first advance estimate) to -6.5% (second advance estimate). The GDP estimate for FY21 however has been revised downwards from the earlier estimate of - 7.7% to -8.0%. This is due to the lower incidence of taxes as well as higher subsidies which has been revised downwards from -13% to -23%. There has also been a downward revision in the Q1 FY21 GDP (from -23.9% to -24.4%) and upward revision in that of Q2 FY21 (from -7.5% to -7.3%). The unlocking of the economy with the steady decline in Covid-19 infection during the period (Oct-Dec) boosted consumption and activity across sectors. The gains in the Indian economy during the October-December’20 period were driven by growth in agriculture, manufacturing, electricity, gas, water & utility services, construction and financial, real estate and professional services. Both consumption (private and government) and investments have recorded a growth (y-o--y) during Q3 FY21, reversing the decline of the preceding two quarters. Despite the improvements, the growth rates are notably lower than that a year ago. The real GDP growth in Q3 FY21 at 0.4% is notably lower than the 3.3% growth of Q3 FY20. The data given below shows the y-o--y GDP growth: Sector-wise performance in Q3 2020-21 (year-on-year) • The agriculture and industrial sector witnessed growth, while the contact intensive services sectors registered negative growth. • The industrial sector has witnessed a growth of 2.7% aided by the growth in manufacturing (1.6%), electricity, gas, water & utility services (7.3%) and construction (6.2%). Manufacturing sector output returned to growth after a gap of four quarters while that a construction turned positive after three quarters, reflective of the higher levels of activity in these segments with the unlocking process. The favourable base effect has also aided the growth in these segments • Agriculture sector grew by 3.9% in Q3 FY21 over the 3% growth of year ago. • The contraction in the services sector eased from an average 16% in the preceding two quarters to -1.0% during OctoberDecember’20 • The core GVA growth, which excludes the agriculture and government sector was 0.7 % in Q3 FY21 against the 1.0% growth in overall GVA, indicating the higher contribution of the industrial and services segment in the improvements in the GVA. • The trade, hotel and transport segment registered the highest contraction amongst the sectors during October-December at (-)7.7%. • Public administration, defence and other services saw growth contract by -1.5% in Q3 FY21. There was however an improvement from the contraction of over 9% in the preceding two quarters reflective of the higher spending being undertaken by the government during the quarter gone by. Sector-wise growth highlights agricultural and industrial growth, the table given below shows the sectoral growth:Agriculture, forestry & fishing Q3 FY17 7.4 Q3 FY18 Q3FY19 Q3 FY20 Q3 FY215.1 2.0 3.4 3.9Industry 8.2 7.7 5.0 -2.5 2.7 Mining & quarrying 9.1 4.7 -4.4 -3.5 -5.9 Manufacturing 8.3 9.3 5.2 -2.9 1.6 Electricity, gas ,water supply & other utility services 10.2 10.1 9.5 -3.1 7.3 Construction 7.4 4.7 6.6 -1.3 6.2Services 7.2 7.5 7.4 6.0 -1.0 Trade, hotels, transport, communication &  broadcasting 7.9 8.2 7.8 7.0 -7.7 Financial, real estate & professional services 5.2 5.7 6.5 5.5 6.6 Public administration, defence and other services 9.1 8.9 8.1 8.9 -1.5GVA at Basic Price 7.5 7.1 5.6 3.4 1.0Core GVA(excluding agri & public administration) 7.3 7.3 6.2 2.3 0.7Source: MOSPI Consumption and Investments (y-o-y growth ) • There has been a pick- up in consumption – both government and private consumption in the October-December period. • Private consumption which is driver of the economy (accounting for 60% of the GDP) witnessed a growth of 1% in Q3 FY21 Although significantly lower than the 11% growth in Q3 FY20, it is a notable improvement form the growth of (-)25% in Q1 FY21 and (-)8% in Q2 FY21. • Government consumption too witnessed an improvement, growing by nearly 7% in Q3 FY21 from year ago. • Investment’s too have picked up, registering year-on-year growth after a gap of three quarters . Investments measured as Gross Fixed Capital Formation (GCFC) grew by of 6% in Q3 FY21 v/s the 1.4% growth in Q3 FY20. The growth in consumption and investment rates as % of GDP is highlighted in the graph given below: Growth in Expenditure of GDP (current prices) as YoY % change is highlighted in the table given below: Growth in Expenditure of GDP (current prices) – YoY (% change) GFCE Q3 FY17 10.0 Q3 FY18 Q3FY19 Q3 FY20 Q3 FY21 7.2415.4 6.9 14.0 PFCE 14.9 9.8 10.8 11.0 1.03GFCF 7.9 14.8 16.7 1.4 5.91Exports 9.7 9.9 20.3 -2.0 8.38Imports 11.8 14.4 22.2 -10.2 -1.96 GDP (at  current prices) 11.5 11.6 12.5 6.5 5.3Source: MOSPI   Adapted from CARE Ratings analysis.
Next Story
Infrastructure Transport

Sonowal Unveils Eight Projects at NMPA’s Golden Jubilee

Union Minister for Ports, Shipping and Waterways, Shri Sarbananda Sonowal, inaugurated the Curtain Raiser Ceremony of the Golden Jubilee Celebrations of the New Mangalore Port Authority (NMPA) at Bharat Mandapam. To commemorate the milestone, he unveiled eight major maritime infrastructure projects designed to strengthen India’s port network, enhance logistics performance, and promote sustainability. These include a modern cruise terminal, new covered storage facilities, a 150-bed multi-speciality hospital, expanded truck terminals, and improved port access infrastructure aimed at enhancing..

Next Story
Infrastructure Energy

India To Boost US LPG Imports, Cut Middle East Reliance

India is planning to reduce imports of liquefied petroleum gas (LPG) from the Middle East as state-owned refiners prepare to ramp up purchases from the United States, according to sources familiar with the matter. The move aligns with New Delhi’s efforts to expand energy cooperation and secure a broader trade deal with Washington. State refiners have already notified their traditional LPG suppliers in Saudi Arabia, the United Arab Emirates, Kuwait and Qatar of the potential reduction in imports. Although the exact size of the supply cut was not disclosed, earlier reports suggested that Indi..

Next Story
Infrastructure Energy

UK Sanctions Nayara Energy in Crackdown on Russian Oil

The United Kingdom has announced fresh sanctions on 90 entities, including Indian refiner Nayara Energy Limited, in its latest bid to curb Russian oil revenues and weaken President Vladimir Putin’s war funding. The sanctions, unveiled jointly by the Foreign, Commonwealth and Development Office (FCDO) and the UK Treasury, aim to disrupt networks supporting Moscow’s crude exports amid the ongoing war in Ukraine. According to the FCDO, the new restrictions are intended to “strike at the heart of Putin’s war funding” by targeting firms and assets that enable Russia’s energy trade. “..

Advertisement

Subscribe to Our Newsletter

Get daily newsletters around different themes from Construction world.

STAY CONNECTED

Advertisement

Advertisement

Advertisement

Talk to us?