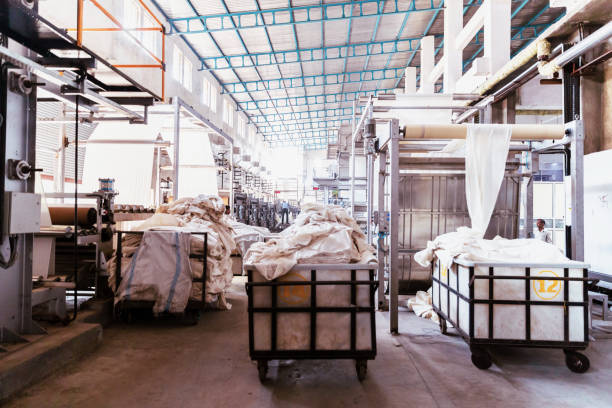
Mumbai witnesses warehousing transactions of 5.8 mn sq ft in FY 2021
TRANSACTION IN WAREHOUSING SPACE
Source: Knight Frank Research
According to the report, the largest demand driving sector for warehouses in Mumbai was 3rd-Party-Logistics (3PL) players which accounted for 53% of the transactions during FY 2021, compared to 72% in FY 2020. E-commerce companies accounted for 30% of the share of transactions for the same period, up from 12% during FY 2020. The increased reliance on online shopping during the pandemic has resulted in many e-commerce players to expand their last-mile-delivery footprint and take up additional warehousing space either directly or through their 3PL partners.

Source: Knight Frank Research
With respect to cluster split transactions, Mumbai’s warehousing cluster in Bhiwandi took up over 99% share of transactions during FY 2021. The transformation of Bhiwandi into an affordable housing destination will prove a major challenge for warehouse operations in the region. Warehouses moving out of Bhiwandi are shifting along with Mumbai – Nasik Highway (NH 3), which provides better access routes to MMR. Major warehouse projects such as KSquare, BGR, Renaissance and ESR are in Bhiwandi; along with large occupiers such as Amazon, Flipkart, DHL, Neelkamal and DB Schenkar all have their presence in the region. FY 2021 saw less than 1% of transactions in the Panvel warehousing cluster. This region has been unable to attract the consumption demand from Bhiwandi, despite having better infrastructure. Export-import (EXIM) demand is the prime demand driver for warehousing in this cluster.

Source: Knight Frank Research
The report also adds that the warehousing activities (i.e. storage related activities) accounted for almost 100% of the transactions by volume during FY 2021. When considering warehouse rentals during the same period, Bhiwandi cluster saw corrections of 4% – 8% as occupiers asked for better contractual terms because of the pandemic. While rents remained unchanged in the Panvel warehousing cluster during the same period. The regions of Palaspe – Goa Road and Taloja from the Panvel Cluster recorded having the highest rent in the range of INR 269 – 323 /sq m/month (INR 25 – 30 /sq ft/month).
Balbirsingh Khalsa, National Director, Industrial & Logistics, Knight Frank India said, “We saw a blip in warehousing demand in MMR in FY 2021 on account of the extended lockdown in MMR. However, the rapid growth in the e-commerce and 3PL segments has made up for decline in demand from other segments to some extent. These two segments made up to 83% of transactions in FY 2021. As the pace of vaccination rises and the lockdown restrictions are eased further, we expect the demand from the other segments to bounce back in this financial year.”
MUMBAI: LAND RATE AND RENTS
Source: Knight Frank Research
Pecan Realty Completes Rs 1.5 Billion Transactions
Pecan Realty has recently completed four institutional transactions worth over Rs 1.5 billion over the past two years, strengthening its position as an execution-led real estate platform. The deals include resolution-led acquisitions, structured finance transactions and capital partnerships across its development portfolio.The transactions covered acquisitions through the National Company Law Tribunal process and helped provide repayment or exits to both private and public sector lenders. The company said the deals demonstrate its ability to resolve complex project situations, work with instit..
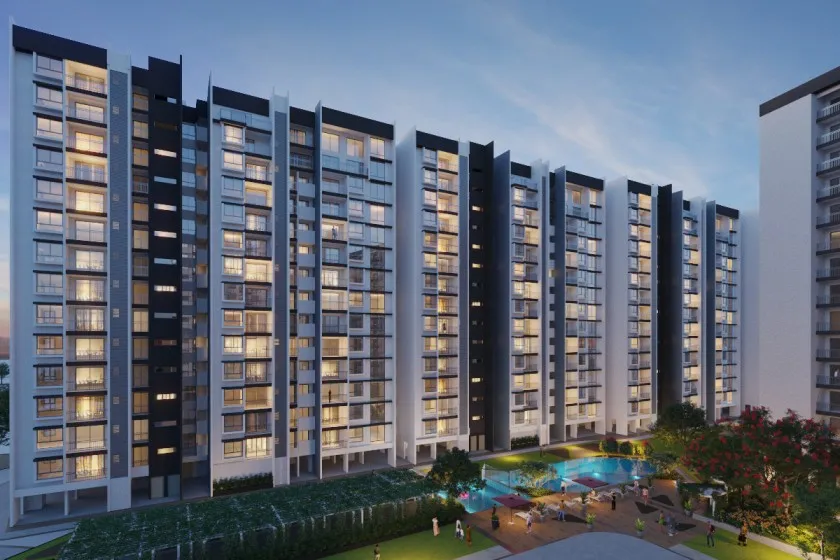
SNN Estates Expands North Bengaluru Housing Project
SNN Estates has announced an expansion of its SNN Estates Felicity residential project in North Bengaluru following strong buyer demand, with 75 per cent of the first-phase inventory sold within three days of launch.The developer will add 76 apartments in the new phase, taking the project's estimated revenue potential to around Rs 1,000 crore upon completion of Phase 2.Spread across 6.5 acres in Rachenahalli, near Manyata Tech Park, the project comprises 604 apartments in 1.5, 2, 2.5, 3 and 4 BHK configurations. The development includes a 50,000-sq-ft clubhouse with amenities such as sports co..

SCG Drives ASEAN Industrial Transformation Strategy
SCG is strengthening its focus on ASEAN as a key growth region by advancing industrial transformation, enhancing competitiveness and building resilient regional value chains. Thammasak Sethaudom, President and Chief Executive Officer, SCG, highlighted the need for industries to continuously develop capabilities, strengthen resilience and deepen regional cooperation to achieve sustainable long-term growth.SCG views ASEAN as an important growth engine alongside China, supported by favourable demographics, trade connectivity and investment flows. With ASEAN’s GDP projected to grow by around 4.7..
Latest Updates