Renewables dominate 95% of US interconnection queues amid backlog increase
POWER & RENEWABLE ENERGY

Renewables dominate 95% of US interconnection queues amid backlog increase
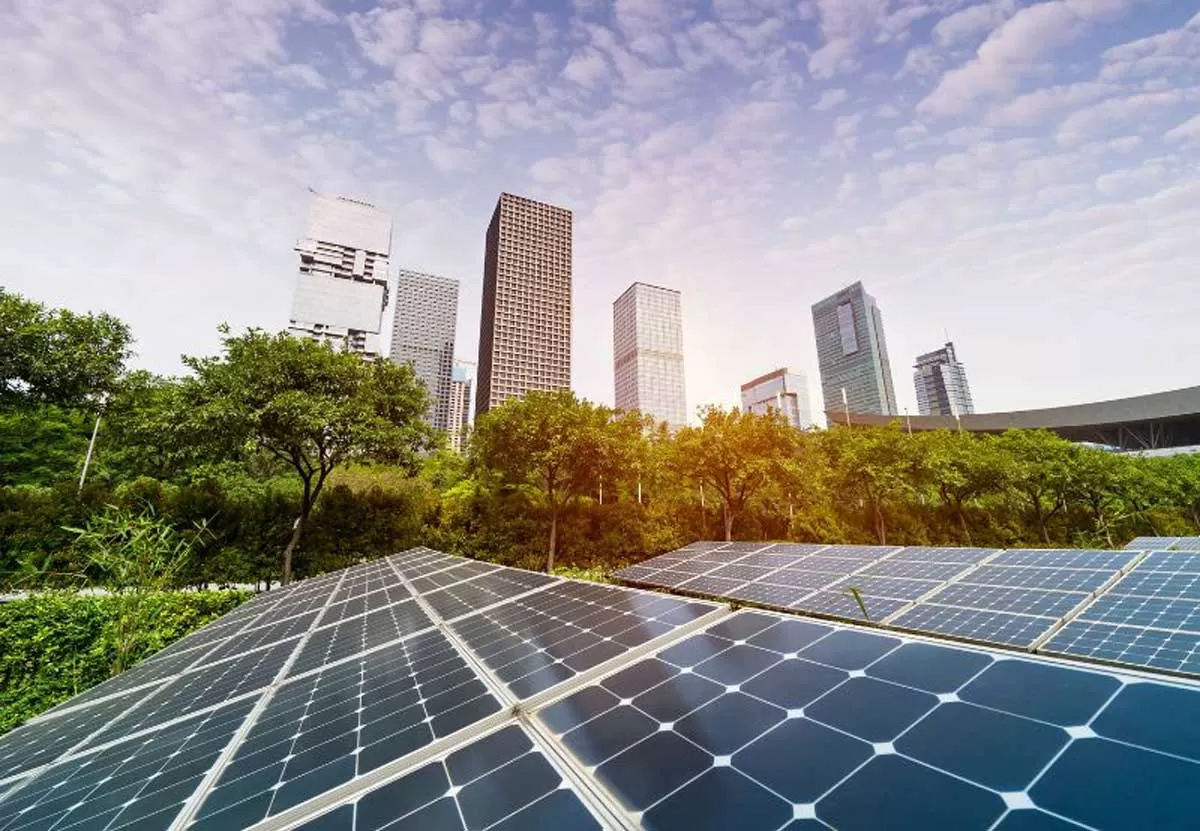
There are nearly 12,000 power projects in the US seeking grid connection, with an overwhelming majority of them based on renewable sources. The combined capacity of these projects is 1,570 GW, with an additional 1,030 GW for storage. It was reported that renewable sources make up 95% of the total capacity in the active queue, and approximately 94% (about 1,480 GW) of the proposed generation capacity is zero-carbon, as per a recent Berkeley Lab report.

Utilities and regional grid operators require projects seeking grid connection to undergo a series of assessments before construction begins. These assessments determine if new grid system enhancements are necessary for a project to integrate into the system, estimating and allocating the associated equipment costs. The lists of projects applying for grid connection and undergoing evaluation are referred to as "interconnection queues."

Despite ongoing interest from developers in solar, storage, and wind energy, completion rates for these projects remain low, leading to longer wait times. Only around 19% of projects (equivalent to 14% of total capacity) that requested interconnection between 2000 and 2018 were operational by the end of 2023.

Completion rates are particularly low for solar (14%) and battery (11%) projects. The average time projects spend in the queue before becoming operational has significantly increased. In 2023, an average project took nearly five years from the interconnection request to commercial operations, compared to three years in 2015 and less than two years in 2008.

The proposed capacity is spread across the US, with solar capacity proposed in most regions, totalling over 1 TW in active queues. Additionally, there is over 1 TW of storage capacity in the queues, mainly concentrated in the Western region and California Independent System Operator (CAISO), but also present in the Electric Reliability Council of Texas (ERCOT), Midcontinent Independent System Operator (MISOM), and Pennsylvania-Jersey-Maryland Interconnection (PJM). Wind capacity accounts for over 360 GW in the queues, with the majority located in the non-ISO West, New York Independent System Operator (NYISO) (offshore), PJM, and Southwest Power Pool (SPP) regions.

Collectively, solar (1,086 GW), storage (1,028 GW), and wind (366 GW) represent 95% of the total active capacity in the queues. Most of the solar and storage capacity is part of hybrid power projects.

There are nearly 12,000 power projects in the US seeking grid connection, with an overwhelming majority of them based on renewable sources. The combined capacity of these projects is 1,570 GW, with an additional 1,030 GW for storage. It was reported that renewable sources make up 95% of the total capacity in the active queue, and approximately 94% (about 1,480 GW) of the proposed generation capacity is zero-carbon, as per a recent Berkeley Lab report. Utilities and regional grid operators require projects seeking grid connection to undergo a series of assessments before construction begins. These assessments determine if new grid system enhancements are necessary for a project to integrate into the system, estimating and allocating the associated equipment costs. The lists of projects applying for grid connection and undergoing evaluation are referred to as interconnection queues. Despite ongoing interest from developers in solar, storage, and wind energy, completion rates for these projects remain low, leading to longer wait times. Only around 19% of projects (equivalent to 14% of total capacity) that requested interconnection between 2000 and 2018 were operational by the end of 2023. Completion rates are particularly low for solar (14%) and battery (11%) projects. The average time projects spend in the queue before becoming operational has significantly increased. In 2023, an average project took nearly five years from the interconnection request to commercial operations, compared to three years in 2015 and less than two years in 2008. The proposed capacity is spread across the US, with solar capacity proposed in most regions, totalling over 1 TW in active queues. Additionally, there is over 1 TW of storage capacity in the queues, mainly concentrated in the Western region and California Independent System Operator (CAISO), but also present in the Electric Reliability Council of Texas (ERCOT), Midcontinent Independent System Operator (MISOM), and Pennsylvania-Jersey-Maryland Interconnection (PJM). Wind capacity accounts for over 360 GW in the queues, with the majority located in the non-ISO West, New York Independent System Operator (NYISO) (offshore), PJM, and Southwest Power Pool (SPP) regions. Collectively, solar (1,086 GW), storage (1,028 GW), and wind (366 GW) represent 95% of the total active capacity in the queues. Most of the solar and storage capacity is part of hybrid power projects.

Next Story
Infrastructure Transport

Cabinet Approves Key Highway and Rail Projects in Bihar Region

The Union Cabinet on Wednesday approved the four-laning of the 84.2-km Mokama-Munger section of the Buxar-Bhagalpur high-speed corridor, a key industrial region in poll-bound Bihar. The Cabinet also sanctioned the doubling of the 177-km Bhagalpur-Dumka-Rampurhat railway line, which passes through Bihar, Jharkhand, and West Bengal, at a cost of Rs 31.7 billion.The Rs 44.5 billion highway project will be constructed under the hybrid annuity model, a variant of public-private partnership. The Mokama-Munger stretch was the only remaining two-lane section of the 363-km Buxar-Bhagalpur corridor. Fou..

Next Story
Infrastructure Transport

NGT Issues Notice on Bengaluru Twin Tunnel Project

The National Green Tribunal (NGT) on Wednesday issued notices in response to a petition filed by Bengaluru Praja Vedike and others, challenging the Bengaluru twin tunnel road project. Petitioners claim the project was “hastily announced” and bypassed mandatory environmental impact assessment procedures.Notices have been served to the Karnataka Government, Greater Bengaluru Authority, State Environment Impact Assessment Authority (SEIAA), Bengaluru Smart Infrastructure Ltd (B-SMILE), the Union Ministry of Environment, Forest and Climate Change, and project consultants.The 16.74-km twin-tube..

Next Story
Real Estate

India’s Residential Sales to Dip Slightly in FY26

Residential sales in India’s seven major cities are projected to decline by up to 3 per cent year-on-year in FY26 to 620–640 million square feet (msf), amid a moderation in sales velocity, according to ratings agency Icra.In FY25, sales stood at 643 msf, down 8 per cent YoY, following a sharp contraction in new launches and moderated demand in the affordable and mid-income segments. This slowdown came after the sector posted a robust compound annual growth rate of 26 per cent in area sales between FY22 and FY24.Icra noted: “Having seen a strong upcycle, the sector entered an equilibrium ..

Advertisement

Subscribe to Our Newsletter

Get daily newsletters around different themes from Construction world.

STAY CONNECTED

Advertisement

Advertisement

Advertisement

Talk to us?