
GDP growth in Q3 shows V-shaped growth
India is one of the select few economies that have witnessed positive growth in the three month period October-December 2020.
This gives credence to the general expectation of a quick revival in the domestic economy and this has led to the government revising upwards it growth estimate for gross value added for FY21 from -7.2% (first advance estimate) to -6.5% (second advance estimate). The GDP estimate for FY21 however has been revised downwards from the earlier estimate of - 7.7% to -8.0%. This is due to the lower incidence of taxes as well as higher subsidies which has been revised downwards from -13% to -23%. There has also been a downward revision in the Q1 FY21 GDP (from -23.9% to -24.4%) and upward revision in that of Q2 FY21 (from -7.5% to -7.3%).
The unlocking of the economy with the steady decline in Covid-19 infection during the period (Oct-Dec) boosted consumption and activity across sectors. The gains in the Indian economy during the October-December’20 period were driven by growth in agriculture, manufacturing, electricity, gas, water & utility services, construction and financial, real estate and professional services.
Both consumption (private and government) and investments have recorded a growth (y-o--y) during Q3 FY21, reversing the decline of the preceding two quarters. Despite the improvements, the growth rates are notably lower than that a year ago. The real GDP growth in Q3 FY21 at 0.4% is notably lower than the 3.3% growth of Q3 FY20.
The data given below shows the y-o--y GDP growth:

Sector-wise performance in Q3 2020-21 (year-on-year)
• The agriculture and industrial sector witnessed growth, while the contact intensive services sectors registered negative growth.
• The industrial sector has witnessed a growth of 2.7% aided by the growth in manufacturing (1.6%), electricity, gas, water & utility services (7.3%) and construction (6.2%). Manufacturing sector output returned to growth after a gap of four quarters while that a construction turned positive after three quarters, reflective of the higher levels of activity in these segments with the unlocking process. The favourable base effect has also aided the growth in these segments
• Agriculture sector grew by 3.9% in Q3 FY21 over the 3% growth of year ago.
• The contraction in the services sector eased from an average 16% in the preceding two quarters to -1.0% during OctoberDecember’20
• The core GVA growth, which excludes the agriculture and government sector was 0.7 % in Q3 FY21 against the 1.0% growth in overall GVA, indicating the higher contribution of the industrial and services segment in the improvements in the GVA.
• The trade, hotel and transport segment registered the highest contraction amongst the sectors during October-December at (-)7.7%.
• Public administration, defence and other services saw growth contract by -1.5% in Q3 FY21. There was however an improvement from the contraction of over 9% in the preceding two quarters reflective of the higher spending being undertaken by the government during the quarter gone by.
Sector-wise growth highlights agricultural and industrial growth, the table given below shows the sectoral growth:
Source: MOSPI
Consumption and Investments (y-o-y growth )
• There has been a pick- up in consumption – both government and private consumption in the October-December period.
• Private consumption which is driver of the economy (accounting for 60% of the GDP) witnessed a growth of 1% in Q3 FY21 Although significantly lower than the 11% growth in Q3 FY20, it is a notable improvement form the growth of (-)25% in Q1 FY21 and (-)8% in Q2 FY21.
• Government consumption too witnessed an improvement, growing by nearly 7% in Q3 FY21 from year ago.
• Investment’s too have picked up, registering year-on-year growth after a gap of three quarters . Investments measured as Gross Fixed Capital Formation (GCFC) grew by of 6% in Q3 FY21 v/s the 1.4% growth in Q3 FY20.
The growth in consumption and investment rates as % of GDP is highlighted in the graph given below:

Growth in Expenditure of GDP (current prices) as YoY % change is highlighted in the table given below:
Growth in Expenditure of GDP (current prices) – YoY (% change)
Source: MOSPI
Adapted from CARE Ratings analysis.
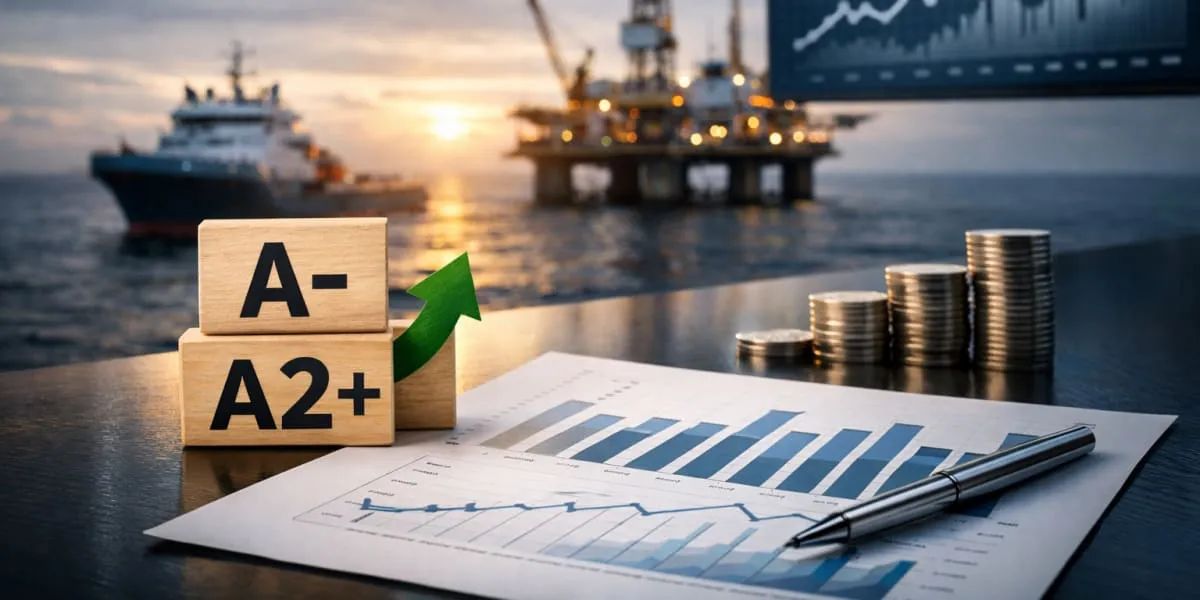
ABS Marine Sees CRISIL Credit Rating Upgrade
ABS Marine Services has secured an upgrade to its long term and short term credit ratings from CRISIL, reflecting improved profitability and revenue growth through long term contracts. CRISIL moved the long term rating from BBB+/Stable to A-/Stable and revised the short term rating from A2 to A2+. The action signals strengthened financial metrics and operational resilience. The company benefited from durable client relationships with firms such as ONGC and Schlumberger. The rating decision followed stronger cash flows and an enlarged bank loan facility, which increased from Rs 3,705 million (m..

Project BRAHMANK Marks 16 Years Of Strategic Roads In Arunachal
Project BRAHMANK is marking 16 years of work to establish strategic road and bridge links across Arunachal Pradesh, maintaining and developing 811 kilometres of roads and nearly 86 bridges that range from small culverts to large steel and arch bridges. These transport links are described as critical for ensuring year-round movement of defence personnel, equipment and essential supplies while improving everyday travel for people in remote villages. The project balances national security requirements with regional development by focusing on reliable access in challenging terrain. Notable enginee..
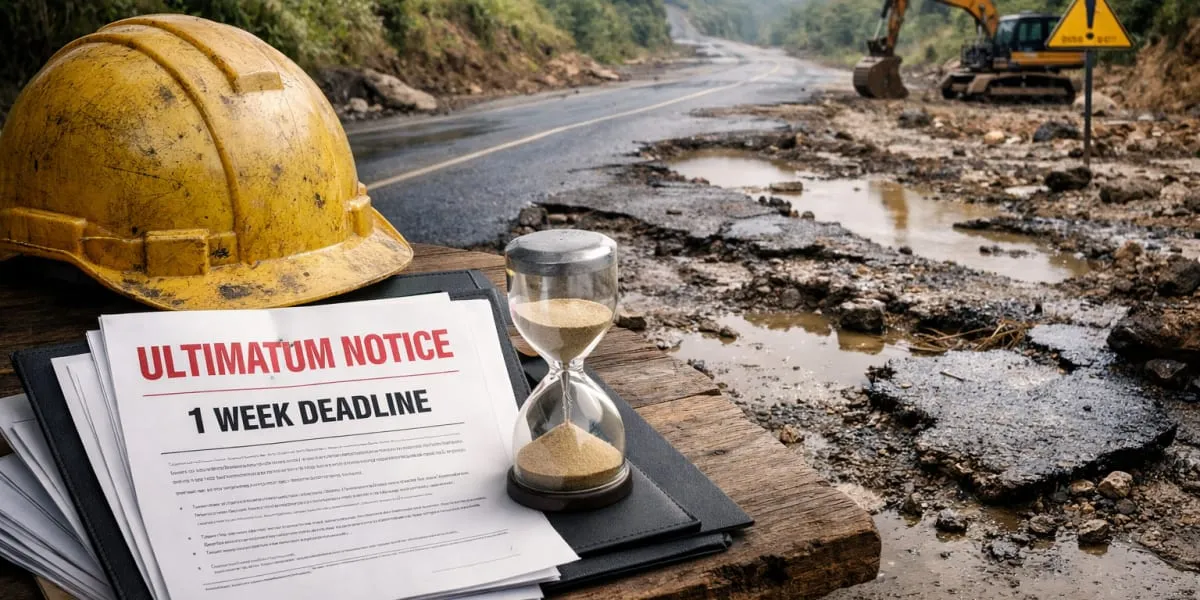
Longleng CSOs Give One Week Ultimatum Over Two-Lane Highway
Civil society organisations (CSOs) in Longleng district have demanded immediate restoration of the deteriorating Changtongya–Longleng two-lane road and sought a detailed status report on the stalled construction within one week. The demand followed a consultative meeting convened under the Phom Peoples' Council (PPC) to discuss welfare and development concerns. PPC president YB Angam Phom said prolonged non-maintenance had caused hardship to commuters and affected transportation, local commerce and the district's development. The meeting urged authorities to undertake immediate restoration a..
Latest Updates