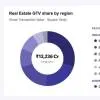
Spurt in demand for affordable housing pushes up overall residential sales
Jyoti Structures FY26 profit rises 56.5%
Jyoti Structures (JSL) recently reported strong financial results for the quarter and year ended 31 March 2026, driven by disciplined execution, cost management and steady progress across its order book.For Q4 FY2025-26, total income rose 44.2 per cent to Rs 2.41 billion from Rs 1.67 billion in Q4 FY2024-25. EBITDA increased 58.6 per cent to Rs 237 million, while EBITDA margin improved by 89 basis points to 9.84 per cent. Profit before tax grew 53.3 per cent to Rs 188.5 million, and net profit rose 51.9 per cent to Rs 181.4 million.For FY2025-26, total income grew 53.1 per cent to Rs 7.72 bill..
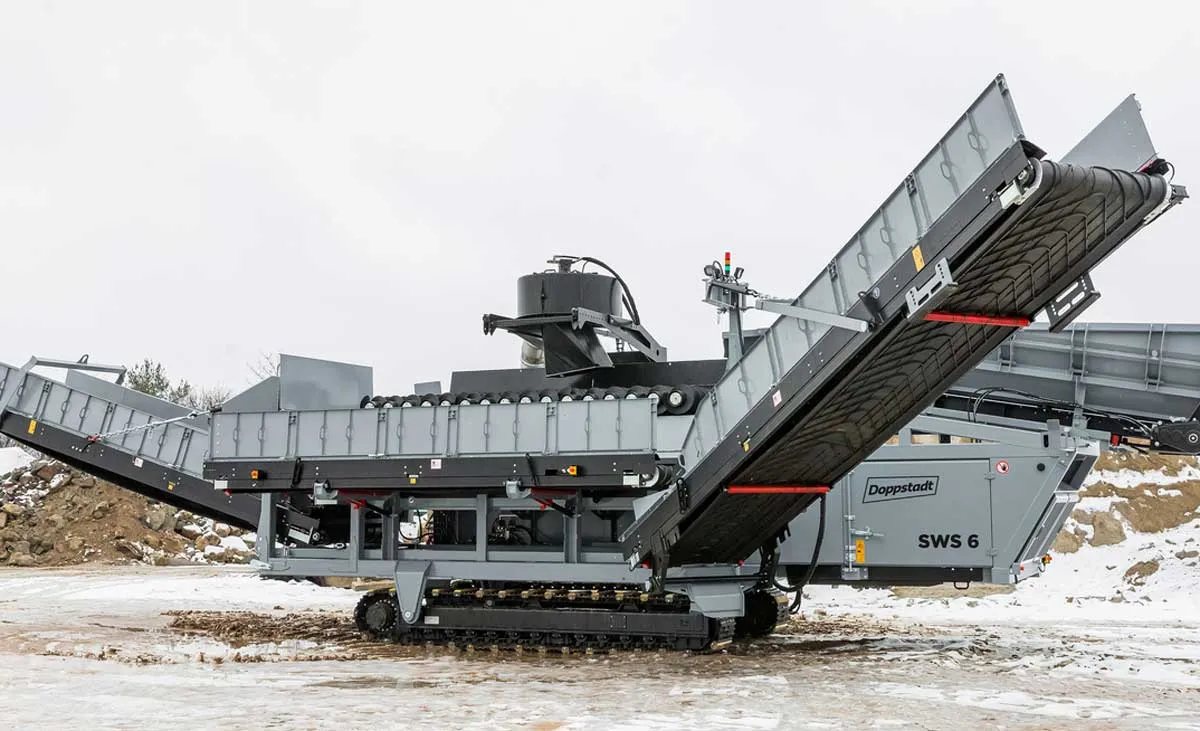
Cat BEPU to Power Doppstadt Separator at IFAT 2026
Caterpillar’s Cat Battery Electric Power Unit (BEPU) has been selected by Doppstadt to power its SWS 6 Spiral Shaft Separator, which will be showcased for the first time at IFAT 2026 in Munich, Germany, from 4–7 May.The compact plug-and-play BEPU is designed to replace a diesel engine within the same space, using the same mounting locations and relative machine position. It integrates the battery, motor, inverter, onboard charging, cooling and controls, enabling OEMs to electrify existing chassis platforms without extensive redesign.Caterpillar and Cat dealer Zeppelin Power Systems have be..

VECV sales rise 6.9% in April 2026
VE Commercial Vehicles, a joint venture between Volvo Group and Eicher Motors, recorded sales of 7,318 units in April 2026, compared to 6,846 units in April 2025, registering 6.9 per cent growth. The total included 7,159 units under the Eicher brand and 159 units under the Volvo brand.Eicher branded trucks and buses reported sales of 7,159 units during the month, up 6.6 per cent from 6,717 units in April 2025. In the domestic commercial vehicle market, Eicher sales rose 8.6 per cent to 6,797 units from 6,257 units a year earlier.Exports declined 21.3 per cent, with VECV recording 362 units in ..
Latest Updates